
説明
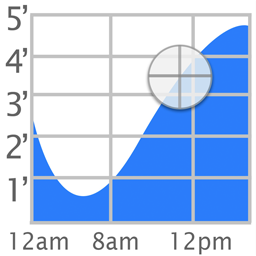
The popular iOS Tide Graph app is now available as a WordPress widget.
スクリーンショット

Settings
インストール
To install Tide Graph,
- Upload
tide-graph.phpto the/wp-content/plugins/directory - Activate the plugin through the ‘Plugins’ menu in WordPress
- Go to Appearance->Widgets and enable the Tide Graph widget.
- To change the settings, go to Appearance->Customize->Widgets. Then select on the area where your widget (ex. Footer). Finally select Tide Graph Widget to see the options: Background, Scale, Location, Latitude, and Longitude.
FAQ
- How do I change the location
-
Click on the map button and select a new location. Then highlight the name of the station that appears above the graph.
- What colors are allowed
-
Colors can be white, black, transparent, or a 6 digit hex value preceeded by a # sign (ex. #FFFFFF)
評価

2018年7月23日
I use this plug-in on a local website (LBI) for use by people visiting the Bay and Ocean side for fishing. Although the plug-in has not been updated in two years, it is still useful and runs on WordPress 4.9.7 with no apparent issues.
貢献者と開発者

変更履歴
1.0
- Initial Release
1.1
- Fixed widths of input fields
1.4
- Added icons and banner
2.0
- Added support for php 7